GENETICS
Genetics
is the study of heredity. Heredity is a biological process where a parent
passes certain genes onto their children or offspring. Every child inherits genes
from both of their biological parents and these genes in turn express specific
traits. Some of these traits may be physical for example hair and eye color and
skin color etc. On the other handsome genes may also carry the risk of certain
diseases and disorders that may pass on from parents to their offspring.
Gregor Johann Mendel
was a scientist and Augustinian friar and abbot of St. Thomas' Abbey in Brno
who gained posthumous fame as the founder of the modern science of genetics.
Though farmers had known for centuries that crossbreeding of animals and plants
could favor certain desirable traits, Mendel's pea plant experiments conducted
between 1856 and 1863 established many of the rules of heredity, now referred
to as the laws of Mendelian inheritance.
Mendel
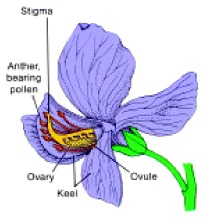
worked with seven characteristics of pea plants: plant height, pod shape and
color, seed shape and color, and flower position and color. With seed color, he
showed that when a yellow pea and a green pea were bred together their
offspring plant was always yellow. However, in the next generation of plants,
the green peas reappeared at a ratio of 1:3. To explain this phenomenon, Mendel
coined the terms “recessive” and “dominant” in reference to certain traits. (In
the preceding example, green peas are recessive and yellow peas are dominant.)
He published his work in 1866, demonstrating the actions of invisible
“factors”—now called genes—in providing for visible traits in predictable ways
in the journal “Annual Proceedings of the National History Society” of Brunn. However, his paper was not accepted till 1990.
TERMINOLOGY
Gene:
The basic unit of heredity; a segment
of DNA which contains the information for a specific characteristic or
function.
Allele:
An alternative form of a gene that occurs at the same locus
on homologous chromosomes, e.g., A, B, and O genes are
alleles.
Genotype: the genetic make-up (the assemblage of
alleles) of an individual.
Phenotype - the physical or chemical expression of
an organism’s genes.
Homozygous – Individual possessing a pair of
identical alleles for a particular locus (gene).
Heterozygous - Individual possessing a pair of unlike
alleles for a particular locus (gene).
Gamete
- a haploid (n) sex cell in plants and animals (egg or
sperm)
Haploid
- the condition of having only one set of chromosomes per
cell (n)
Diploid
- the condition of having two sets of chromosomes per cell
(2n)
Dominant
allele - an allele that is always expressed
when present, regardless of whether the organism is homozygous or heterozygous
for that gene.
Recessive
allele - an allele that is only expressed when
the organism is homozygous for that allele and not expressed when heterozygous
(when paired with a dominant allele).
Parent
generation (P) - the generation that supplies gametes
to the filial generation.
Filial
generation (F) - the generation that receives gametes
from the parental generation (Filial means brother in Latin).
Linkage:
The tendency for genes or segments of DNA
which are located close together on the same chromosome to be inherited
together.
Progeny
Testing: It
is a test of the value for selective breeding of an individual's genotype by
looking at the progeny produced by different matings.
Cross pollination (fertilization) - Pollination
by genetically different plants
Self
pollination (fertilization) - The
natural or artificial pollination of a female flower with pollen from the same
genotype.
Wild
type (WT): It
refers to the phenotype of the typical form of a species as it occurs in
nature.
Mutant: An organism, gene, or chromosome that
is different from the wild type by one or more.
Mendel’s
Law:
There
are about three laws proposed by Mendel.
They are
Mendel's first law (also called the
law of segregation) states
that during the formation of reproductive cells (gametes), pairs of hereditary factors (genes) for a specific trait separate so that offspring receive one factor from each parent.
Mendel's second law (also called the law of independent assortment)
states that chance determines which factor for a particular trait is inherited.
Mendel's third law (also called the law of dominance) states
that one of the factors for a pair of inherited traits will be dominant and the other recessive, unless both factors are recessive.
Some
alleles do not have complete dominance and instead have incomplete dominance by
expressing an intermediate phenotype, or codominance by expressing both alleles
at once.
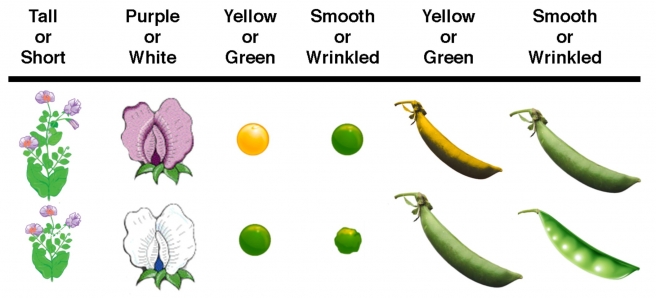
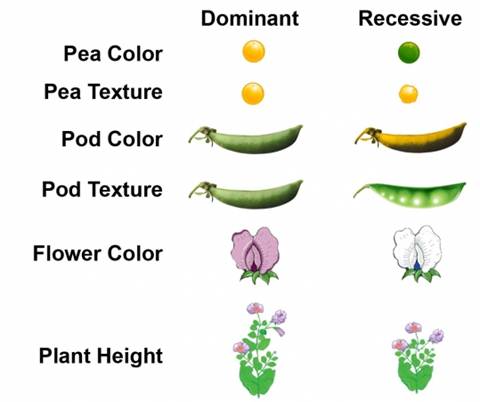
The seven
character differences studied by Mendel:
Applications of Mendel’s
Law
Mendel’s laws can be easily applied
a. In breading experiments of plants and animals
b. In improving the varieties of plants and animals
c. In studying the various physical, physiological and pathological traits in human beings
d. In the improvement of eugenics
Results of All Mendel’s Crosses in
Which Parents Differed in One Character
|
Parental
phenotype |
F1
|
F2
|
F2 ratio
|
|
1. Round×wrinkled
seeds |
All round |
5474 round;
1850 wrinkled |
2.96:1 |
|
2. Yellow×green
seeds |
All yellow |
6022 yellow; 2001 green |
3.01:1 |
|
3. Purple×white
petals |
All purple |
705 purple; 224 white |
3.15:1 |
|
4. Inflated×pinched
pods |
All inflated |
882 inflated; 299 pinched |
2.95:1 |
|
5. Green×yellow
pods |
All green |
428 green; 152 yellow |
2.82:1 |
|
6. Axial×terminal
flowers |
All axial |
651 axial;
207 terminal |
3.14:1 |
|
7. Long×short
stems |
All long |
787 long;
277 short |
2.84:1 |
Law of dominance
experiment (Monohybrid Ratio)
The phenotypic ratio of different
types of individuals occurring in the F2 generation of the
monohybrid cross is called the monohybrid ratio. In the Mendelian
monohybrid experiments, this ratio was always 3:1 ( i.e.,
75% is dominant and 25% is recessive). For example, for one of his monohybrid
crosses, Mendel selected true breeding homozygous parents showing contrasting
characters for the height of the plant. He performed the experiment in three
stages as described.
According to Mendel, each sexually reproducing diploid organism possesses two 'factors' (genes) for each character; one factor is received (inherited) from male parent and the other factor is inherited from the female parent. These two factors for a particular character are called alleles or allelomorphs. When an offspring receives identical alleles from both parents, it is called homozygous, pure or true breeding for the character. On the other hand, when the offspring receives dissimilar alleles from two parents, it is called heterozygous, impure or a hybrid for that character.
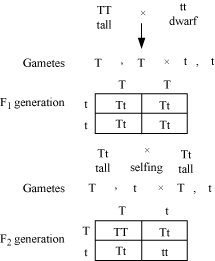
The pure tall is crossed with the
pure dwarf parent. According to Mendel, when the diploid individual (having
both the alleles/factors) produces gametes, each gamete receives only one of
the two factors/alleles of a character. No gamete receives both the alleles of
a character. Thus, pure tall parent produces only one type of gametes, i.e. all
the gametes possess only (T) factor for tallness. Similarly, all gametes
produced by pure dwarf are of one type only and possess (t) factor. The fusion
of (T) and (t) gametes (fertilization) results in the F1 offspring
with (Tt) genotype. It is heterozygous or a hybrid. Its phenotype
(external appearance) is tall because the factor for tallness (T) is
dominant and expresses itself. The factor for dwarfness (t) is present in
F1 hybrid but, being recessive, does not express itself (remains hidden).
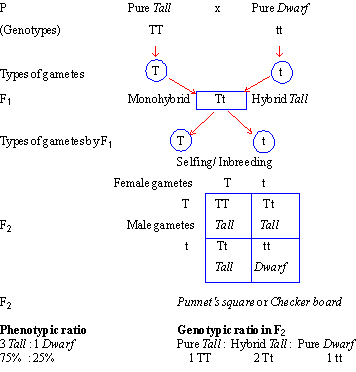
Mendel allowed hybrids to self-fertilize
or inbreed to raise F2 generation. The F1 hybrid has
dissimilar alleles (Tt). Therefore, it will produce two types of gametes in
equal number i.e. 50% gametes will have (T) factor and remaining 50% will have
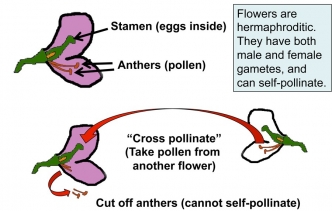
(t) factor. Since the pea flower is bisexual, it produces both male and female
gametes. Thus, the F1 hybrid will produce two types of male gametes (T) and (t)
in equal numbers. Similarly, there will be two types of female gametes (T) and
(t) in equal numbers. During self fertilization, the
fusion between these male and female gametes occurs at random. For example,
each type of male gamete has an equal chance to fuse with either (T) or (t)
female gametes and vice-versa. This chance fusion, between two types of male
and two types of female gametes will produce a maximum of four combinations
(genotypes) in the F2 progeny. This is shown in the checker board or Punnet’s Square. These four combinations fall
into three categories of the genotypes as follows : 1
(TT), 2 (Tt) and 1 (tt) i.e.
1 Pure tall : 2 Hybrid tall : 1 Pure
dwarf
(TT) 2(Tt)
(tt)
This is called 1:2:1 genotypic
ratio of a monohybrid cross. However, phenotypically, the progeny shows 3
Tall and 1 Dwarf individuals (75% Dominant and 25% recessive characters) or 3:1
ratio. This is called monohybrid ratio or phenotypic ratio of a
monohybrid cross.
The
result indicates that even though the recessive character was not seen in
hybrid, it was present there and reappeared in pure form in 25% individuals of
the progeny. This result also enabled Mendel to conclude that the two factors
(alleles) come together in the hybrid but do not mix or fuse with each other.
They simply remain together without diluting or contaminating each other. In
other words, factors maintain their purity. As the gamete always
receives only one factor (alleles) for a trait, it is always pure for the
character. This is called purity of gametes.
Reason
for tallness as dominants:
The growth of body is controlled by
pituitary hormone or somatotrophic or growth
hormone. Dominant gene for tallness is
responsible to develop normal pituitary and to produce sufficient growth
hormone that results normal size or tallness.
Even heterozygous condition is enough to produce the sufficient
hormone. In homozygous recessive
condition neither normal pituitary is developed nor sufficient growth hormone
secreted that is why they become dwarf.
Exceptions
from Mendel’s Law: (Deviations from Law of Dominance)
There are some exceptions to the
“rules” of Mendel. They are truly exceptions in that they do not alter any of
his conclusions or application of his ideas.
Incomplete Dominance:
In some cases, there is no clear dominant or recessive allele. For example,
some heterozygous flowers display an intermediate coloration. This occurs in
such cases because both genes keep functioning. Since these genes code
for a colored protein, a heterozygote ends up making half of each color. Note
that it is fortunate that Mendel’s pea plants weren’t subject to this
phenomenon, or he might not have come to his amazing conclusions.
It is the situation in which both
alleles of the heterozygote influences the
phenotype. The phenotype is usually
intermediate between the two homozygous forms.
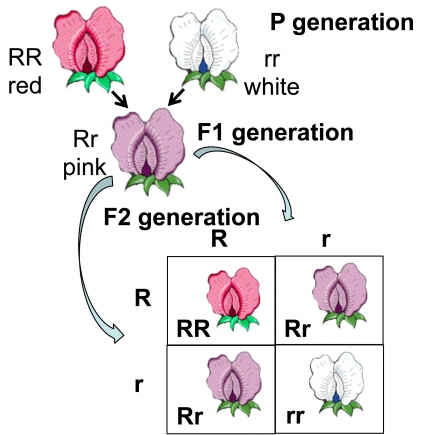
In the snapdragon (Antirrhinum majus) or the Four O clock plant (Mirabilis jalapa), a cross between red and white flowered plants
produces an all pink F1 progeny. This
intermediate inheritance or partial inheritance is called incomplete
dominance. The F1 when selfed gives F2 progenies which are red, pink and white in
the ration of 1:2:1. Pink is therefore
heterozygous phenotype. The phenotypic
and genotypic ratios are the same in the case of incomplete dominance. However,
incomplete dominance is not an evidence for blending inheritance. One fourth each of the F2 progeny have the
parental red and white phenotypes, which would not be possible if blending
truly occurred. The alleles of the genes
are therefore discrete or particulate.
This phenomenon is also seen in Andulsian fowl, when a homozygous black feathered
fowl is crossed to a homozygous white feathered hen, the F1 generations are
hybrids showing blue color of feathers.
On selfing, these F1 individuals, F2
generations show 1 black : 2 blue : 1 white feathered
individuals.
Codominance:
The situation in which a heterozygote shows the phenotypic effects of both alleles equally. When the dominant character is not able to suppress, even incompletely the recessive character and both the characters appear side by side in F1 hybrids, the phenomenon is called as codominancy.
It can be seen in leaves pattern in Trifolium species (Clover plants), coat color in cattle and blood groups in humans.
The best examples come from cattle. In cattle, if cattle with black coat is crossed with white coat, the F1 heterozygotes are found to possess roan coat. In roan coat, black and white patches appear separately but no hair has intermediate color of black and white.
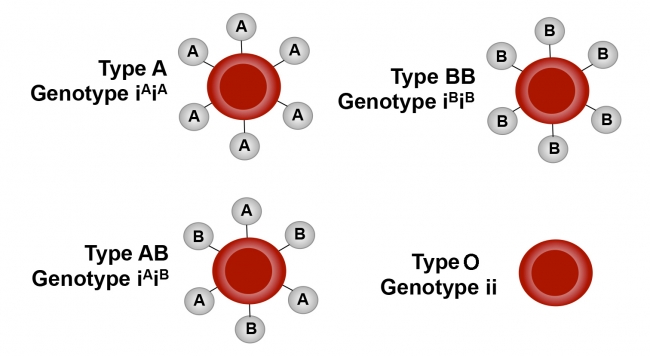
Co-Dominance of Multiple Alleles Humans have three alleles that contribute to blood type: A, B or neither, which is termed “O.” An individual only has two of the possible alleles (one on each homologous chromosome). However, none of the alleles are dominant. Rather, they are all fully expressed, which is referred to as co-dominance. An individual inheriting two A alleles will have a blood type of AA, two B alleles will have BB, an A and a O will have AO, a B and an O will have BO, an O and an O will have type OO, and finally an A and a B will have type AB. This so far is like a simple Punnett square analysis. However, the blood type protein is one of those “self-recognition” proteins on the surface of blood cells, and receiving a transfusion of the “wrong” blood type can induce a serious immune reaction requiring treatment. Functionally, since O is “null”, AA and AO are the same, BB and BO are the same, and AB is unique. Someone with type A (AA or AO) can receive AA, AO or OO. Someone with type B can receive BB, BO or OO. Someone with type AB can receive any blood type, while someone with type O can only receive OO.
Another “exception” to Mendel is Polygenic Inheritance. This refers to
phenotypes that result from the combined action of more than one gene. For
example, the size of a bird’s beak results from the interplay of a number of
genes, each of which has a dominant and recessive allele.
The same is true for human height.
As a result of the contribution of multiple dominant and recessive alleles of
different genes, we observe a gradation of height, rather than the distinct
tall or short forms of Mendel’s pea plants.
GENE
MAPPING IN HAPLOIDS AND DIPLOIDS
Gene mapping describes the methods used to identify the locus of a gene and the distances between genes. There are two distinctive types of "Maps" used in the field of genome mapping: genetic maps and physical maps. While both maps are a collection of genetic markers and gene loci, genetic maps' distances are based on the genetic linkage information, while physical maps use actual physical distances usually measured in number of base pairs. Genetic markers themselves usually consist of DNA that does not contain a gene. But because markers can help a researcher locate a disease-causing gene, they are extremely valuable for tracking inheritance of traits through generations of a family.
Genetic maps are useful in many ways: they allow us to understand the overall complexity and genetic organization of a particular species, improve our understanding of the evolutionary relationships among different species, can be used to diagnose, and perhaps, someday to treat inherited human diseases, can help in predicting the likelihood that a couple will produce children with certain inherited diseases and provide helpful information for improving agriculturally important strains through selective breeding programs. Mapping the genes of different types of organisms (diploid, haploid, eukaryotic, prokaryotic) gives geneticists insight into genetic processes.
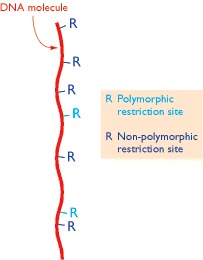
Restriction mapping
Genetic mapping using RFLPs as DNA markers can locate the positions of polymorphic restriction sites within a genome, but very few of the restriction sites in a genome are polymorphic, so many sites are not mapped by this technique.
The simplest way to construct a restriction map is to compare the fragment sizes produced when a DNA molecule is digested with two different restriction enzymes that recognize different target sequences. An example using the restriction enzymes EcoRI and BamHI is shown in figure. First, the DNA molecule is digested with just one of the enzymes and the sizes of the resulting fragments are measured by agarose gel electrophoresis. Next, the molecule is digested with the second enzyme and the resulting fragments again sized in an agarose gel. The results so far enable the number of restriction sites for each enzyme to be worked out, but do not allow their relative positions to be determined. Additional information is therefore obtained by cutting the DNA molecule with both enzymes together. In the example shown in figure, this double restriction enables three of the sites to be mapped. However, a problem arises with the larger EcoRI fragment because this contains two BamHI sites and there are two alternative possibilities for the map location of the outer one of these. The problem is solved by going back to the original DNA molecule and treating it again with BamHI on its own, but this time preventing the digestion from going to completion by, for example, incubating the reaction for only a short time or using a suboptimal incubation temperature. This is called a partial restriction and leads to a more complex set of products, the complete restriction products now being supplemented with partially restricted fragments that still contain one or more uncut BamHI sites. In the example shown in figure, the size of one of the partial restriction fragments is diagnostic and the correct map can be identified.
A partial restriction usually gives the information needed to complete a map, but if there are many restriction sites then this type of analysis becomes unwieldy, simply because there are so many different fragments to consider. An alternative strategy is simpler because it enables the majority of the fragments to be ignored. This is achieved by attaching a radioactive or other type of marker to each end of the starting DNA molecule before carrying out the partial digestion. The result is that many of the partial restriction products become ‘invisible’ because they do not contain an end-fragment and so do not show up when the agarose gel is screened for labeled products. The sizes of the partial restriction products that are visible enable unmapped sites to be positioned relative to the ends of the starting molecule.
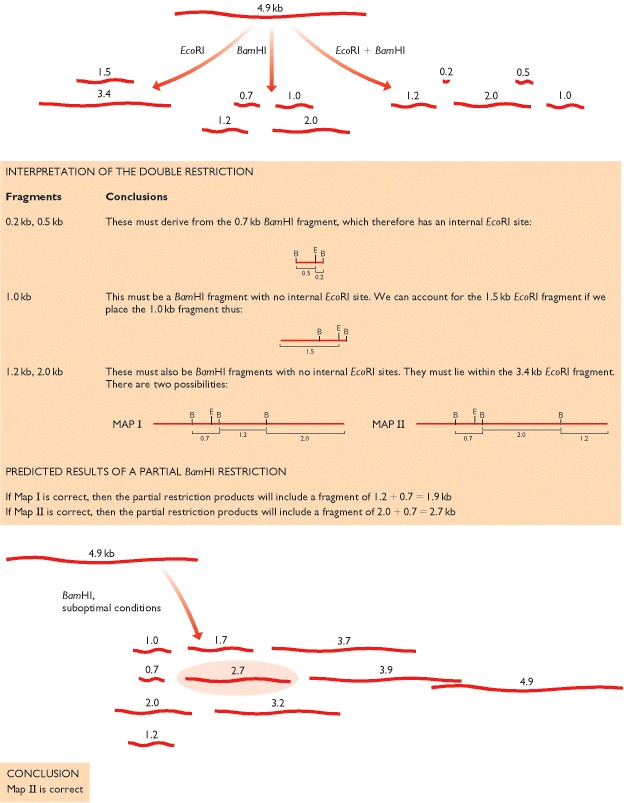
The objective is to map the EcoRI
(E) and BamHI (B) sites in a linear DNA
molecule of 4.9 kb. The results of single and double restrictions are shown at
the top. The sizes of the fragments given after double restriction enable two
alternative maps to be constructed, as explained in the central panel, the unresolved
issue being the position of one of the three BamHI
sites. The two maps are tested by a partial BamHI
restriction (bottom), which shows that Map II is the correct one.
The scale of restriction mapping is limited by the
sizes of the restriction fragments
Restriction maps are easy to generate if there are relatively few cut sites for the enzymes being used. However, as the number of cut sites increases, so also do the numbers of single, double and partial restriction products whose sizes must be determined and compared in order for the map to be constructed. Computer analysis can be brought into play but problems still eventually arise. A stage will be reached when a digest contains so many fragments that individual bands merge on the agarose gel, increasing the chances of one or more fragments being measured incorrectly or missed out entirely. If several fragments have similar sizes then even if they can all be identified, it may not be possible to assemble them into an unambiguous map.
Restriction mapping is therefore more applicable to small rather than large molecules, with the upper limit for the technique depending on the frequency of the restriction sites in the molecule being mapped. In practice, if a DNA molecule is less than 50 kb in length it is usually possible to construct an unambiguous restriction map for a selection of enzymes with six-nucleotide recognition sequences. Fifty kb is of course way below the minimum size for bacterial or eukaryotic chromosomes, although it does cover a few viral and organelle genomes, and whole-genome restriction maps have indeed been important in directing sequencing projects with these small molecules. Restriction maps are equally useful after bacterial or eukaryotic genomic DNA has been cloned, if the cloned fragments are less than 50 kb, because a detailed restriction map can then be built up as a preliminary to sequencing the cloned region.
These ‘rare cutters’ fall into two categories:
- Enzymes with seven- or eight-nucleotide recognition sequences. A few restriction enzymes cut at seven- or eight-nucleotide recognition sequences. Examples are SapI (5′-GCTCTTC-3′) and SgfI (5′-GCGATCGC-3′). The seven-nucleotide enzymes would be expected, on average, to cut a DNA molecule with a GC content of 50% once every 47 = 16 384 bp. The eight-nucleotide enzymes should cut once every 48 = 65 536 bp. These figures compare with 46 = 4096 bp for six-nucleotide enzymes such as BamHI and EcoRI. Seven- and eight-nucleotide cutters are often used in restriction mapping of large molecules but the approach is not as useful as it might be simply because not many of these enzymes are known.
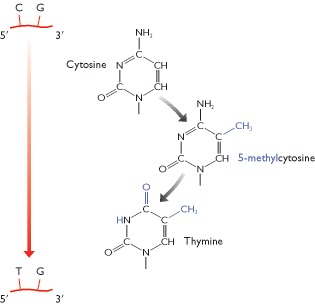
- Enzymes whose recognition sequences contain motifs that are rare in the target DNA. Genomic DNA molecules do not have random sequences and some are significantly deficient in certain motifs. For example, the sequence 5′-CG-3′ is rare in human DNA because human cells possess an enzyme that adds a methyl group to carbon 5 of the C nucleotide in this sequence. The resulting 5-methylcytosine is unstable and tends to undergo deamination to give thymine. The consequence is that during human evolution many of the 5′-CG-3′ sequences that were originally in our genome have become converted to 5′-TG-3′. Restriction enzymes that recognize a site containing 5′-CG-3′ therefore cut human DNA relatively infrequently. Examples are SmaI (5′-CCCGGG-3′), which cuts human DNA on average once every 78 kb, and BssHII (5′-GCGCGC-3′) which cuts once every 390 kb. Note that NotI, an eight-nucleotide cutter, also targets 5′-CG-3′ sequences (recognition sequence 5′-GCGGCCGC-3′) and cuts human DNA very rarely - approximately once every 10 Mb.
The potential of restriction mapping is therefore increased
by using rare cutters. It is still not possible to construct restriction maps
of the genomes of animals and plants, but it is feasible to use the technique
with large cloned fragments, and the smaller DNA molecules of prokaryotes and
lower eukaryotes such as yeast and fungi.
If a rare cutter is used then it may be necessary to employ
a special type of agarose gel electrophoresis to study the resulting
restriction fragments. This is because the relationship between the length of a
DNA molecule and its migration rate in an electrophoresis gel is not linear,
the resolution decreasing as the molecules get longer. This means that it is
not possible to separate molecules more than about 50 kb in length because all
of these longer molecules run as a single slowly migrating band in a standard
agarose gel. To separate them it is necessary to replace the linear electric
field used in conventional gel electrophoresis with a more complex field. An
example is provided by orthogonal field alternation gel electrophoresis (OFAGE),
in which the electric field alternates between two pairs of electrodes, each
positioned at an angle of 45° to the length of the gel. The DNA molecules still
move down through the gel, but each change in the field forces the molecules to
realign. Shorter molecules realign more quickly than longer ones and so migrate
more rapidly through the gel. The overall result is that molecules much longer
than those separated by conventional gel electrophoresis can be resolved.
Related techniques include CHEF (contour clamped homogeneous electric
fields) and FIGE (field inversion gel electrophoresis).
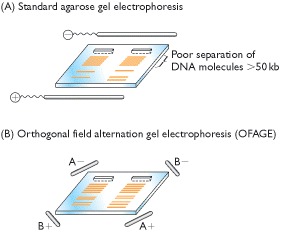
(A) In
standard agarose gel electrophoresis the electrodes
are placed at either end of the gel and the DNA molecules migrate directly
towards the positive electrode. Molecules longer than about 50 kb cannot be
separated from one another in this way. (B) In OFAGE, the electrodes are placed
at the corners of the gel, with the field pulsing between the A pair and the B
pair. OFAGE enables molecules up to 2 Mb to be separated.
Direct examination of DNA molecules for restriction sites
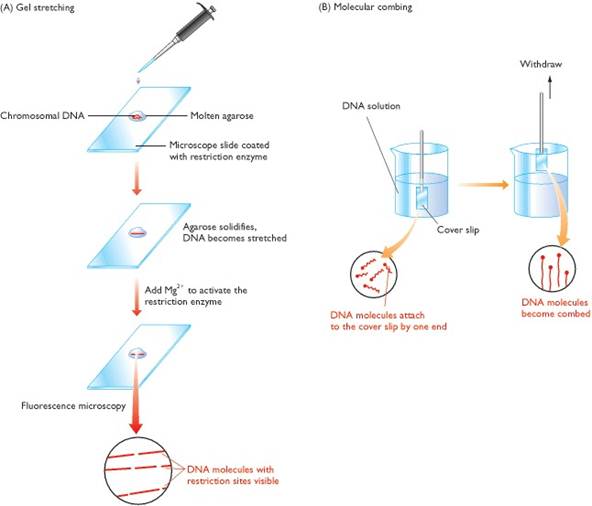
(A) To carry out gel stretching, molten agarose containing
chromosomal DNA molecules is pipetted onto a microscope slide coated with a
restriction enzyme. As the gel solidifies, the DNA molecules become stretched.
It is not understood why this happens but it is thought that fluid movement on
the glass surface during gelation might be responsible. Addition of magnesium
chloride activates the restriction enzyme, which cuts the DNA molecules. As the
molecules gradually coil up, the gaps representing the cut sites become
visible. (B) In molecular combing, a cover slip is dipped into a solution of
DNA. The DNA molecules attach to the cover slip by their ends, and the slip is
withdrawn from the solution at a rate of 0.3 mm s-1, which produces
a ‘comb’ of parallel molecules.
It is also possible to use methods other than electrophoresis to map restriction sites in DNA molecules. With the technique called optical mapping, restriction sites are directly located by looking at the cut DNA molecules with a microscope. The DNA must first be attached to a glass slide in such a way that the individual molecules become stretched out, rather than clumped together in a mass. There are two ways of doing this: gel stretching and molecular combing. To prepare gel-stretched DNA fibers, chromosomal DNA is suspended in molten agarose and placed on a microscope slide. As the gel cools and solidifies, the DNA molecules become extended. To utilize gel stretching in optical mapping, the microscope slide onto which the molten agarose is placed is first coated with a restriction enzyme. The enzyme is inactive at this stage because there are no magnesium ions, which the enzyme needs in order to function. Once the gel has solidified it is washed with a solution containing magnesium chloride, which activates the restriction enzyme. A fluorescent dye is added, such as DAPI (4,6-diamino-2-phenylindole dihydrochloride), which stains the DNA so that the fibers can be seen when the slide is examined with a high-power fluorescence microscope. The restriction sites in the extended molecules gradually become gaps as the degree of fiber extension is reduced by the natural springiness of the DNA, enabling the relative positions of the cuts to be recorded.
In molecular combing, the DNA fibers are prepared by dipping
a silicone-coated cover slip into a solution of DNA, leaving it for 5 minutes
(during which time the DNA molecules attach to the cover slip by their ends),
and then removing the slip at a constant speed of 0.3 mm s-1). The
force required to pull the DNA molecules through the meniscus causes them to
line up. Once in the air, the surface of the cover slip dries, retaining the
DNA molecules as an array of parallel fibers. Optical mapping was first applied
to large DNA fragments cloned in YAC and BAC vectors. More recently, the
feasibility of using this technique with genomic DNA has been proven with
studies of a 1-Mb chromosome of the malaria parasite Plasmodium falciparum,
and the two chromosomes and single megaplasmid of the
bacterium Deinococcus radiodurans.
Bacterial Gene Transfer
1. Gene transfer in bacteria can be accomplished through
conjugation, transformation, and transduction by phages.
2. Conjugation, transformation, and generalized transduction
have in common one important property. Each process introduces a DNA fragment
into the recipient cell; then a double-crossover event must take place if the
fragment is to be incorporated into the recipient genome and subsequently
inherited. Unincorporated fragments cannot replicate and are diluted out and
lost from the population of daughter cells.
3. Sexduction by F′ factors
and specialized transduction by phages are similar processes in that, in each
case, a specific and limited set of bacterial genes is introduced into the
recipient cell. After transfer, the F′ factor replicates in the bacterial
cytoplasm as a separate entity, whereas specialized transducing-phage DNA is
recombined into the bacterial chromosome by a phage-encoded recombination
system. In both cases, a partial diploid (merozygote) results.
4. Gene transfer can be used to map the bacterial
chromosome. Hfr crosses are first used to localize a
mutation to a region of the chromosome. Then, recombinant frequency,
generalized transduction, or transformation provides a more exact localization.
Discovery of conjugation
Conjugation was proved in 1946 by
the elegantly simple experimental work of Joshua Lederberg and Edward Tatum,
who studied two strains of Escherichia coli with different nutritional
requirements. Strain A would grow on a minimal medium only if the medium were
supplemented with methionine and biotin; strain B would grow on a minimal
medium only if it were supplemented with threonine, leucine, and thiamine.
Thus, we can designate strain A as met− bio−
thr+ leu+ thi+ and strain B as met+
bio+ thr− leu−
thi−. The Figure displays in
simplified form the concept of their experiment. Here, strains A and B are
mixed together, and some of the progeny are now wild type, having regained the
ability to grow without added nutrients.
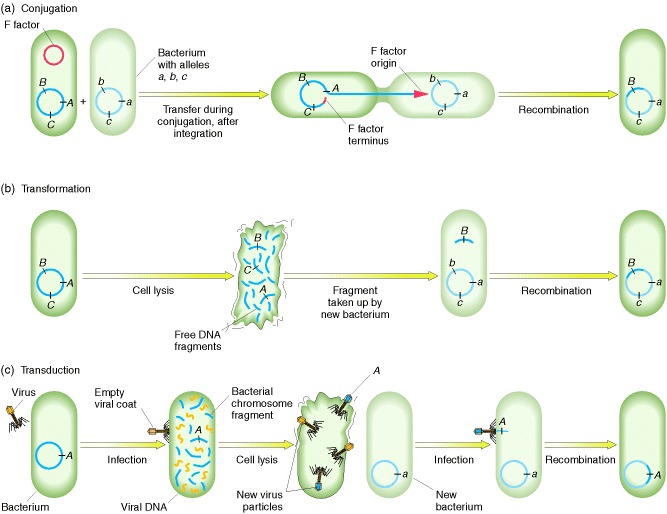
Recombination processes in bacteria. Bacterial recombination
requires that a bacterial cell receive an allele obtained from another cell.
(a) In conjugation, a cytoplasmic element such as the fertility factor (F)
integrates into the chromosome of a bacterial cell. During cell-to-cell
contact, the integrated factor can transfer part or all of that chromosome to
another cell whose chromosome carries alleles of genes on the transferred chromosome.
The transferred segment recombines with a homologous segment in the recipient
cell’s chromosome; in the example shown here, allele B thereby replaces
allele b. (b) In transformation, a DNA segment bearing a particular
allele is taken up from the environment by a cell whose chromosome carries a
matching allele; the alleles (in our example, B and b) are then
exchanged by homologous recombination. (c) In transduction,
after a phage has infected a bacterial cell, one of the newly forming phage
particles picks up a bacterial DNA segment instead of viral DNA. When this
phage particle infects another cell, it injects its bacterial DNA, which
recombines with a homologous segment in the second cell, thereby exchanging any
corresponding alleles (in our example, A and a).
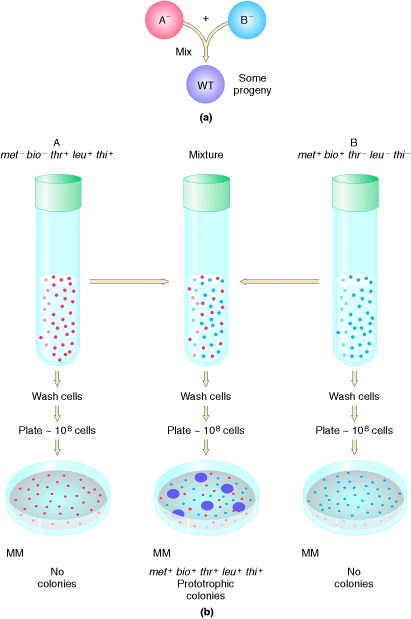
Demonstration by Lederberg and Tatum of genetic recombination between
bacterial cells. Cells of type A or type B cannot grow on an unsupplemented (minimal) medium (MM), because A and B each
carry mutations that cause the inability to synthesize constituents needed for
cell growth. When A and B are mixed for a few hours and then plated, however, a
few colonies appear on the agar plate. These colonies derive from single cells
in which an exchange of genetic material has occurred; they are therefore
capable of synthesizing all the required constituents of metabolism.
Lederberg and Tatum plated
bacteria into dishes containing only unsupplemented
minimal medium. Some of the dishes were plated only with strain A bacteria,
some only with strain B bacteria, and some with a mixture of strain A and
strain B bacteria that had been incubated together for several hours in a
liquid medium containing all the supplements. No colonies arose on plates
containing either strain A or strain B alone, showing that back mutations
cannot restore prototrophy, the ability to grow on unsupplemented
minimal medium. However, the plates that received the mixture of the two
strains produced growing colonies at a frequency of 1 in every 10,000,000 cells
plated (in scientific notation, 1 × 10⁻⁷). This
observation suggested that some form of recombination of genes had taken place
between the genomes of the two strains to produce prototrophs.
Summary of the various events that take place in the conjugational
cycle of E. coli.
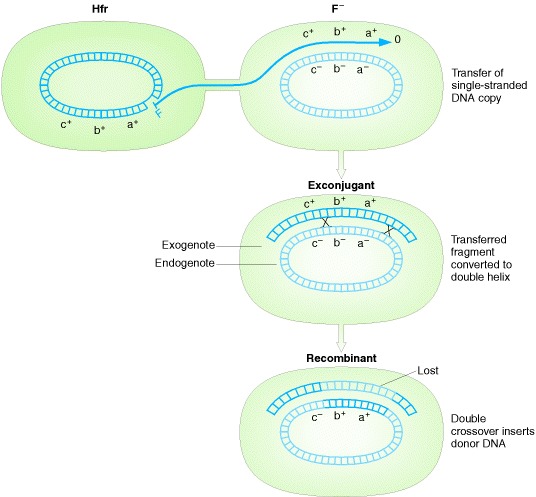
Transfer of single-stranded fragment of donor chromosome, and
recombination with recipient chromosome. note:
double crossovers can occur in any location; those shown are examples.
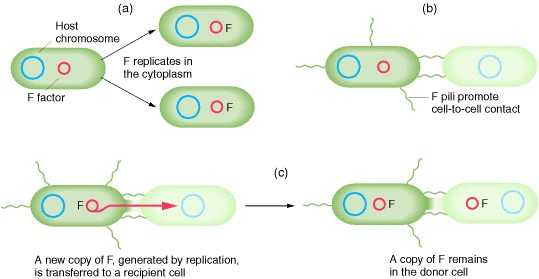
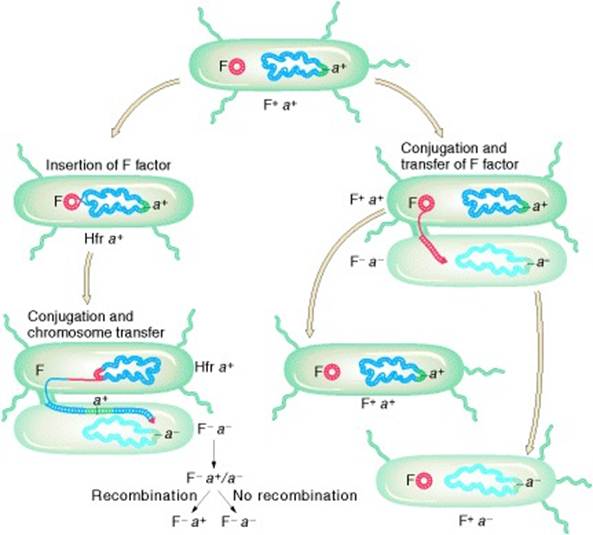
Transfer of F during Conjugation
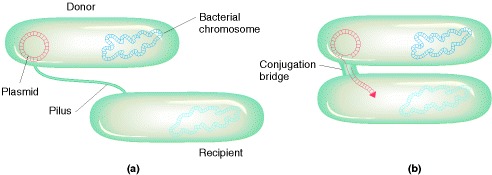
Recombinant genotypes for marker genes are relatively rare in bacterial crosses, Hayes noted, but the F factor apparently was transmitted effectively during physical contact, or conjugation. A kind of “infectious transfer” of the F factor seemed to be taking place. We now know much more about the process of conjugation and about F, which is an example of a plasmid that can replicate in the cytoplasm independently of the host chromosome. The F plasmid directs the synthesis of pili, projections that initiate contact with a recipient and draw it closer, allowing the F DNA to pass through a pore into the recipient cell. One strand of the double-stranded F DNA is transferred and then DNA replication restores the complementary strand in both the donor and the recipient. This replication results in a copy of F remaining in the donor and another appearing in the recipient
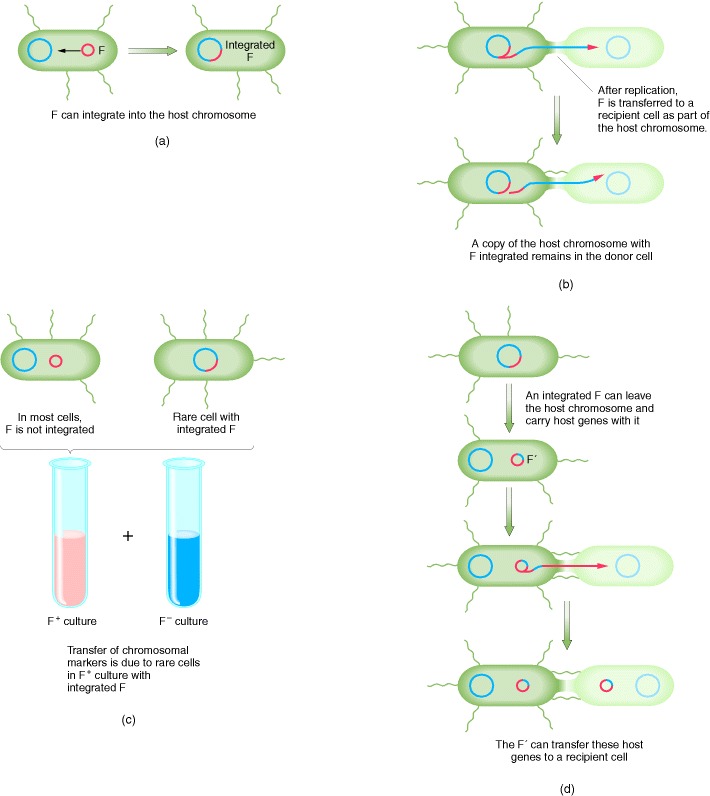
The transfer of E. coli chromosomal markers mediated by F. (a) Occasionally, the independent F factor combines with the E. coli chromosome. (b) When the integrated F transfers to another E. coli cell during conjugation, it carries along any E. coli DNA that is attached, thus transferring host chromosomal markers to a new cell. (c) In a population of F+ cells, a few cells will have F integrated into the chromosome; these few cells can transfer chromosomal markers. Therefore, when a population of F+ cells is mixed with a population of F− cells, a few F− cells will acquire markers from the donor. (d) Occasionally, the integrated F can leave the chromosome and return to the cytoplasm. In rare cases, F can carry host genes with it, incorporating them into the circular F, which is now termed an F′. The F′ can transfer these genes at high efficiency to other cells, because they are part of the F′ genome.
Interrupted-mating conjugation
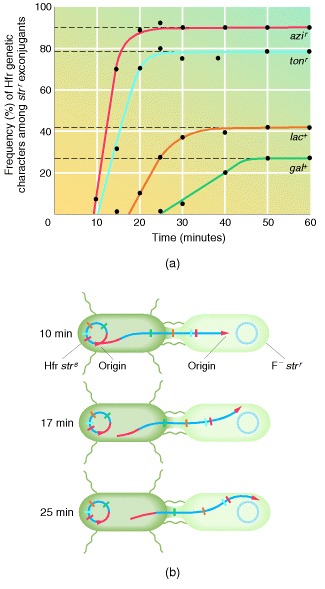
Interrupted-mating conjugation experiments with E. coli. F− cells that are strr are crossed with Hfr cells that are strs. The F− cells have a number of mutations (indicated by the genetic markers azi, ton, lac, and gal) that prevent then from carrying out specific metabolic steps. However, the Hfr cells are capable of carrying out all these steps. At different times after the cells have been mixed, samples are withdrawn, disrupted in a blender to break conjugation between cells, and plated on media containing streptomycin. The antibiotic kills the Hfr cells but allows the F− cells to grow and to be tested for their ability to carry out the four metabolic steps. (a) A plot of the frequency of recombinants for each metabolic marker as a function of time after mating. Transfer of the donor allele for each metabolic step depends on how long conjugation is allowed to continue. (b) A schematic view of the transfer of markers over time.
Transformation
Some bacteria have another method of transferring DNA and producing recombinants that does not require conjugation. The conversion of one genotype into another by the introduction of exogenous DNA (that is, bits of DNA from an external source) is termed transformation. Transformation was discovered in Streptococcus pneumoniae in 1928 by Frederick Griffith; in 1944, Oswald T. Avery, Colin M. MacLeod, and Maclyn McCarty demonstrated that the “transforming principle” was DNA. Bacterial transformation can be demonstrated by using the genes for drug resistance. The exogenous transforming DNA is incorporated into the bacterial chromosome by a double-crossover process analogous to that depicted for Hfr × F− crosses.
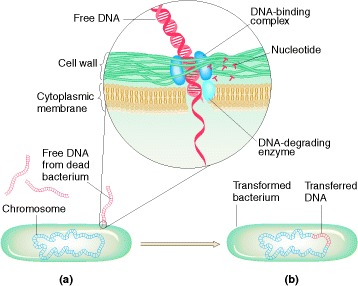
Bacterium undergoing transformation (a) picks up free DNA released
from a dead bacterial cell. As DNA-binding complexes on the bacterial surface
take up the DNA (inset), enzymes break down one strand into nucleotides;
meanwhile the other strand may integrate into the bacterium’s chromosome (b).
Transformation can be used to assess linkage. When the DNA from the donor is extracted for use in a transformation experiment, some breakage into smaller pieces is inevitable. If two donor genes are located close together on the chromosome, then there is a greater chance that they will be carried on the same piece of transforming DNA and hence will cause a double transformation. Conversely, if genes are widely separated on the chromosome, then most likely they will be carried on separate transforming segments and the frequency of double transformants will equal the product of the single-gene transformation frequencies. Thus, it should be possible to test for close linkage by testing for a departure from the product rule. Hence, if a+ b+ donor DNA is used to transform a− b− recipient cells, then, if a and b are closely linked, the proportion of a+ b+ double transformants, or cotransformants, should exceed the product of the proportions of single a+ and b+ transformants. Relative map distances of closely linked genes can be deduced from cotransformation percentages in an approach similar to that used in transduction.
Transduction
Some phages are able to “mobilize”
bacterial genes and carry them from one bacterial cell to another through the process of transduction.
Discovery of transduction
In 1951, Joshua Lederberg and
Norton Zinder were testing for recombination in the bacterium Salmonella
typhimurium by using the techniques that had been successful with E.
coli. The researchers used two different strains: one was phe− trp− tyr−, and the other was met− his−.
When either strain was plated on a minimal medium, no wild-type cells were
observed. However, after the two strains were mixed, wild-type cells appeared
at a frequency of about 1 in 105. Thus far, the situation seems
similar to that for recombination in E. coli.
There are two kinds of transduction: generalized and specialized. Generalized transducing phages can carry any part of the chromosome, whereas specialized transducing phages carry only restricted parts of the bacterial chromosome.
Generalized transduction
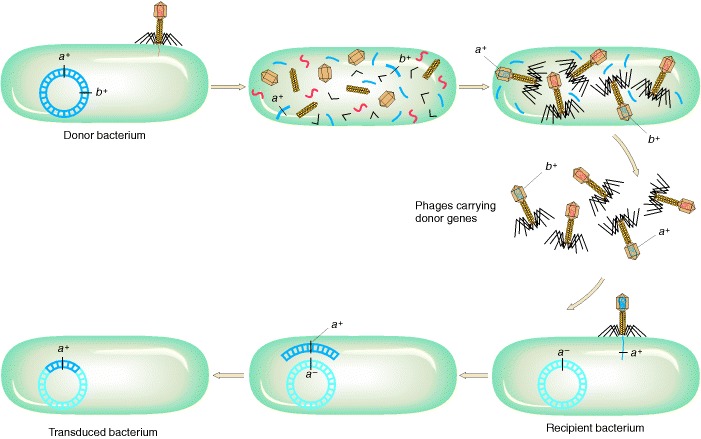
Phages P1 and P22 both show generalized transduction. These temperate phages have different fates in the cell: P22 inserts into the host chromosome as a prophage, whereas P1 remains free like a large plasmid. However, both act as generalized transducers because, in the course of lysis, bacterial DNA is accidentally “stuffed” into the phage head. Inside the recipient cell, the transducing fragments integrate by double crossover utilizing the host recombination system. Generalized transduction can transfer any host gene. It occurs when phage packaging accidentally incorporates bacterial DNA instead of phage DNA.
Linkage date from transduction
Generalized transduction allows us to derive linkage
information about bacterial genes when markers are close enough that the phage
can pick them up and transduce them in a single piece of DNA. For example,
suppose that we wanted to find the linkage between met and arg in E. coli. We might set up a cross of a met+ arg+ strain with a met− arg− strain. We could grow phage P1
on the donor met+ arg+
strain, allow P1 to infect the met− arg− strain, and select for met+
colonies. Then, we could note the percentage of met+ colonies
that became arg+. Strains
transduced to both met+ and arg+
are called cotransductants. Linkage values are usually expressed as cotransduction frequencies. The greater the cotransduction frequency, the closer two genetic markers
are.
Specialized transduction
Specialized transduction is due to faulty separation of the prophage from the bacterial chromosome, so the new phage includes
both phage and bacterial genes. The
transducing phage can transfer only specific host genes. Lambda is a good example of a specialized transducing phage.
As a prophage, λ always inserts between the gal region and the bio
region of the host chromosome. In transduction experiments, λ can
transduce only the gal and bio genes.
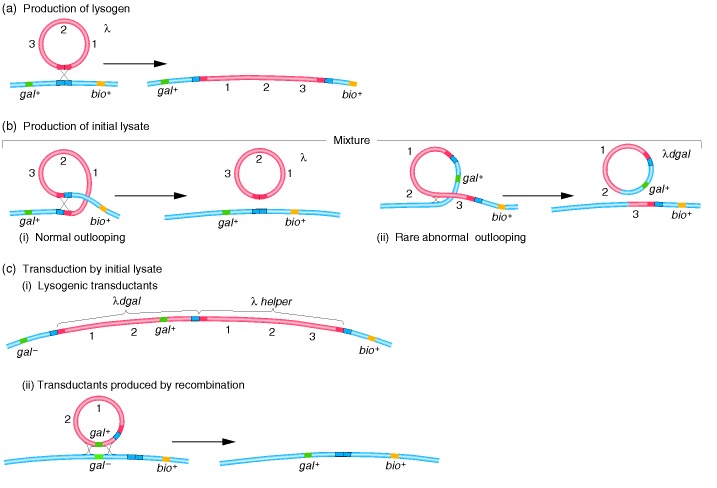
Specialized transduction mechanism in phage λ. (a) The
production of a lysogenic bacterium takes place by crossing-over in a
specialized region. (b) The lysogenic bacterial culture can produce normal
λ or, rarely, an abnormal particle, λdgal,
which is the transducing particle. (c) Transduction by the mixed lysate can
produce gal+ transductants by the coincor-poration of λdgal
and a λ helper phage or, more rarely, by crossovers flanking the gal
gene. The blue double squares are bacterial integration sites, the red double
squares are λ integration sites, and the pairs of blue and red squares are
hybrid integration sites, derived partly from E. coli and partly from
λ.
The recombination between regions of λ and the
bacterial chromosome is catalyzed by a specific enzyme system. This system
normally ensures that λ integrates at the same point in the chromosome
and, when the lytic cycle is induced (for instance, by ultraviolet light), it
ensures that the λ prophage excises at precisely the correct point to
produce a normal circular λ chromosome. Very rarely, excision is abnormal
and can result in phage particles that now carry a nearby gene and leave behind
some phage genes. In λ, the nearby genes are gal on one side and bio
on the other. The resulting particles are defective due to the genes left
behind and are referred to as λdgal
(λ-defective gal), or λdbio.
These defective particles carrying nearby genes can be packaged into phage
heads and can infect other bacteria. In the presence of a second, normal phage
particle in a double infection, the λdgal
can integrate into the chromosome at the λ-attachment site. In this
manner, the gal genes in this case are transduced into the second host.
Because this transduction mechanism is limited to genes very near the original
integrated prophage, it is called specialized transduction.
********